Transients and memory effects
(LW)


Next: Working example:
Up: THE LW ARRAY
Previous: Effect of charged
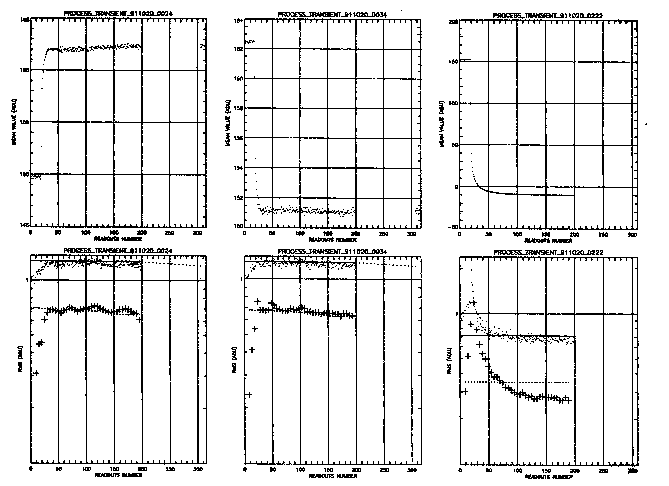
The LW array presents a time lagged response after a flux step (up
or down). The lag depends on the number of readouts of the array,
and is a function of both the initial and the final accumulated
charges. Different pixels have a slightly different response to a
given flux step, resulting in a degraded flatness of the images
after the step. Figures  and
and  show
6 examples of responses after flux steps with
  = 2
sec. For each example, as a function of the readout number, the
upper panel shows the average pixel signal, and the lower panel
shows the distortion of the image compared to the final reference
image obtained by averaging the 10 last elementary images of the
record. The difference between the running image and this final
reference is flat-fielded using the difference between the final
reference and the reference obtained before the flux step. The rms
dispersion is plotted in two cases: i) single elementary images
(dots), and ii) for 11 consecutive images averaged (crosses). This
dispersion can be compared in the two cases to the corresponding
noise that would be expected in stabilized regime (full and dotted
lines, respectively). For all the examples shown, the number of
readouts needed to return to the nominal flat-field exceeds 20.
Consequently, for every use of the LW array, it is recommended to
let the signal stabilize for a number  of
readouts, before the
  exposures useful fo the
observation (Of course, the data product will also include the
stabilization exposures, which can eventually be used to improve
the accuracy of the observation).

Figure: Examples of stabilization of the LW array after a flux
step (upper panels)

Figure: Examples of stabilization of the LW array after a flux
step (lower panels)

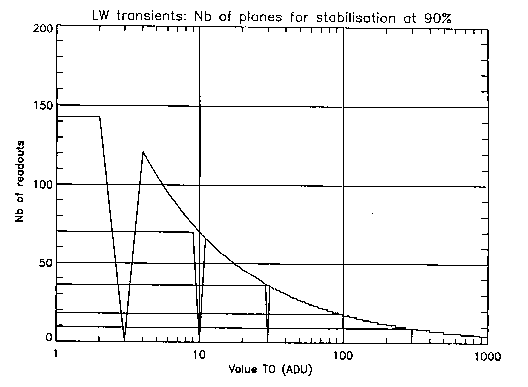
Figure: Flux step dependence of  for the LW array
Figure  gives
gives  using the
photometric criterion that the average pixel has reached its final
reference level within 10 % of the flux step amplitude.
  is plotted as a function of the destination level TO for
the initial FROM levels 3, 10, 30, 100 and 300 ADUs.
The results in Figure  are based on the analysis of 50
cases during the calibration of the flight model. A rough fit (within a
factor 2) of the results is given by the following function:

Where :
FROM is the stabilized signal level in ADUs before the step ( ),
),
TO is the stabilized signal level in ADUs after the step
 = 275,
  = 0.00,
  = 0.60


Next: Working example:
Up: THE LW ARRAY
Previous: Effect of charged
ISOCAM Observer's Manual - V1.0
Tue Oct 31 12:06:23 MET 1995
 and
and  show
6 examples of responses after flux steps with
  = 2
sec. For each example, as a function of the readout number, the
upper panel shows the average pixel signal, and the lower panel
shows the distortion of the image compared to the final reference
image obtained by averaging the 10 last elementary images of the
record. The difference between the running image and this final
reference is flat-fielded using the difference between the final
reference and the reference obtained before the flux step. The rms
dispersion is plotted in two cases: i) single elementary images
(dots), and ii) for 11 consecutive images averaged (crosses). This
dispersion can be compared in the two cases to the corresponding
noise that would be expected in stabilized regime (full and dotted
lines, respectively). For all the examples shown, the number of
readouts needed to return to the nominal flat-field exceeds 20.


 of
readouts, before the
  exposures useful fo the
observation (Of course, the data product will also include the
stabilization exposures, which can eventually be used to improve
the accuracy of the observation).


 ),
), = 275,
  = 0.00,
  = 0.60