 200
200  Jy/''
Jy/'' , and hope to detect diffuse emission with a
surface brightness of
  15
15  Jy/''
Jy/'' . This implies a
signal-to-noise ratio of
  50 on the bright regions.


This technique (CAM03) was found to be the best for an observation where we want to image a bright galaxy, achieving a sufficiently high S/N so that its diffuse emission can also be detected.
We expect the bright regions to have a surface brightness of
 200
200  Jy/''
Jy/'' , and hope to detect diffuse emission with a
surface brightness of
  15
15  Jy/''
Jy/'' . This implies a
signal-to-noise ratio of
  50 on the bright regions.
From the IRAS data, we measure the background level to be at
900  Jy/''
Jy/'' in the LW3 filter. We used the 6'' lens and select
an integration time of 2 s to be sure that the detector does not
saturate on the bright component.
In the beamswitching mode we have to take into account the fact that,
each time we move between the off and on position, we impose a step on
the flux that reaches the detector, and hence we have to wait for it to
stabilize before integrating. Using the simulator, we measured the
number of readouts necessary for reaching 90% of the final flux after
each motion of the telescope to be 18 (the number 13 appearing on
figure  corresponds to a step from 0. flux to
source+background flux, here we need the value for a step from
background to background+source).
After a number of trials, we end up with an ``optimum'' configuration
presented in figure  , where we perform 4 cycles of on-off
motions with a throw of 5'. Once again, the curve of interest is the
lower one, the upper one excluding the slew time between the two
positions. As can be seen, in 500 s there will be 25 readouts per
position, which, after substracting the 18 needed for stabilization,
leaves 7 useful readouts, or a S/N of 53. One could consider
integrating longer, since the S/N is still increasing, but one should
not go beyond 1000 s as the S/N curve saturates.
Once again, one should not forget to add 180 s for pointing.

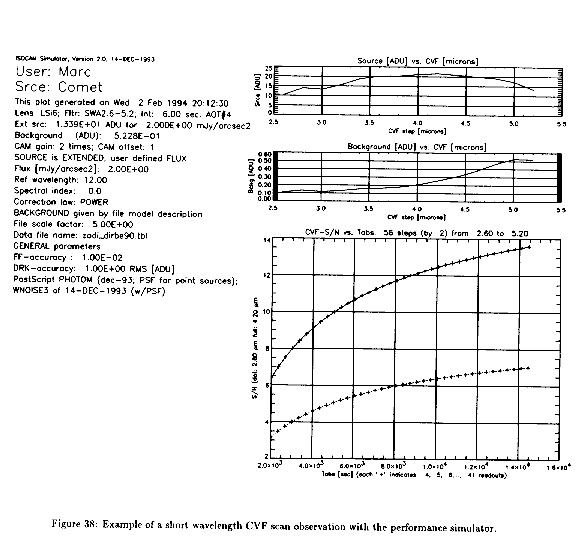
Figure: Example of a short wavelength CVF scan observation with the performance simulator.


