 The Two Micron All Sky Survey at IPAC
|
|
 |
 |
| J/H/Ks color composite of the
2MASS Combined Calibration Scan Image in rho Ophiuchus |
2MASS Extended Mission Data Release
(2006 December 20 - Initial Release)
(2008 March 12 - LMC/SMC Data Release)
This is the release of Ancillary Data Products from the
Two Micron All Sky Survey (2MASS) Extended Mission.
The Ancillary Products are drawn from survey, calibration and
special long exposure observations made at the 2MASS facilities
at Mt. Hopkins, AZ and Cerro Tololo, Chile between June 1997 and
January 2001. They are intended to complement
the highly uniform and reliable All-Sky Release Point and Extended
Source Catalogs and Image Atlas by providing multi-epoch images and
measurements of objects observed multiple times during the survey and
measurements of
sources fainter than may be found in the primary survey Catalogs.
The 2MASS Extended Mission Ancillary Products do not replace the
All-Sky
Release Catalogs and Atlas. Rather they are intended to be used as
a resource to learn more about individual objects where detailed follow-up
is possible, or to conduct studies of fainter objects over small regions
of the sky that do not require the high degrees of uniformity and reliability
that characterize the All-Sky Catalogs. The fainter flux limits and time
sampling in the 2MASS Extended Mission Ancillary Data products are obtained
at the expense of reliability and uniform sky coverage. Furthermore,
the Extended Mission products have not received the same level of validation
and scrutiny as the All-Sky Release products. Consequently, users should
defer to the source data contained in the 2MASS All-Sky Catalogs, whenever
possible.
Users are encouraged to familiarize themselves with the
Explanatory Supplement to the
2MASS All Sky Data Release and Extended Mission Products
before using any 2MASS image, catalog, or database. Please
review the Cautionary Notes sections pertaining to
each Ancillary Product to learn about the limitations of
the Extended Mission data.
The Extended Mission Ancillary Products are (click on product
name to go to a description):
- Survey Point and Extended Source "Reject"
Tables and Full Survey Image Atlas
- 6x Point and Extended Source Working Databases and Catalogs and 6x Image Atlas
- Calibration Scan Point and Extended Source Working Databases and Calibration Image Atlas
- Survey, 6x and Calibration Merged Point and Extended Source Information and Cross-Reference Tables
- Combined Calibration Scan Image and Source Lists
- Tables containing positions and fluxes for 843,988,897 point
source and 943,441 extended source detections extracted from all
2MASS survey observations made in photometric conditions that are not
contained in the 2MASS All-Sky PSC and XSC. The "Reject"
Tables include:
- One or more independent measurements of objects in the ~30% of
the sky observed more than once during 2MASS survey-mode observations
to supplement the single apparitions selected for the All-Sky PSC and XSC
- Low-SNR sources below the All-Sky Catalog thresholds for reliability
which are a mixture of faint objects and noise excursions
- Spurious detections of image artifacts and transient events such
as cosmic rays and residual meteor trails.
- 4,879,128 photometrically and astrometrically calibrated
FITS images in the three 2MASS bandpasses constructed from all survey
mode observations. These include the 4,121,439 images released as part
All-Sky Release Image Atlas, and 757,689 images from repeated observations
of selected regions.
 |
 |
 |
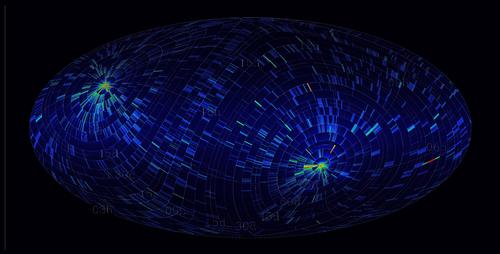
| Figure 1 - 2MASS survey depth-of-coverage map, galactic
aitoff projection, showing Tile overlap regions and full Tiles observed
multiple times. |
Figure 2 - Cumulative area of sky plotted as a function of
number of independent survey observations from repeated Tile scans. |
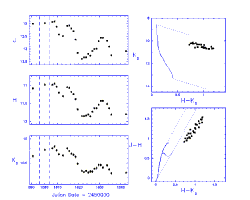
Figure 3 - (left) Light curves of a candidate
pre-main sequence star in the Orion Molecular Cloud, and (right) its
evolution in the color-color and color-magnitude plane
(Carpenter et al. 2001)
constructed from 28 independent survey scans of the region. |
- 24,023,702 point and 247,091 extended sources
extracted from a set of special observations made at the end
of 2MASS survey operations that used exposure times six times (6x) longer than
the main 2MASS survey measurements. These measurements reached
~1 mag deeper than the main 2MASS survey,
and covered approximately 590 deg2 of sky in 30 regions containing
targets of interest including star formation regions, the Pleiades,
nearby galaxies and galaxy clusters, the Lockman Hole and the Large
and Small Magellanic Clouds.
The 6x point and extended source tables are released as integrated
Catalog/Working Databases. The Working Databases may contain
more than one independent detection of objects scanned multiple times,
and a significant number of unreliable extractions of noise and image
artifacts.
The 6x Point and Extended Source Catalogs (denoted by cat=1)
are a uniform and reliable subset of objects in 6x Point and Extended
Source Working Databases. These Catalogs are appropriate for
use in statistical studies analogous to the All-Sky
PSC and XSC, but over the limited areas covered by the 6x observations.
- 69,687 photometrically and astrometrically calibrated
FITS images in the three 2MASS bandpasses constructed from the long exposure
observations of all fields.
 |
 |
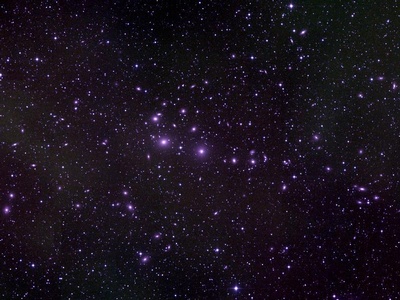
| Figure 4 - J/H/Ks color composite showing a 0.9°x0.7°
region in the core of the Abell 426 (Perseus) galaxy cluster 6x field. |
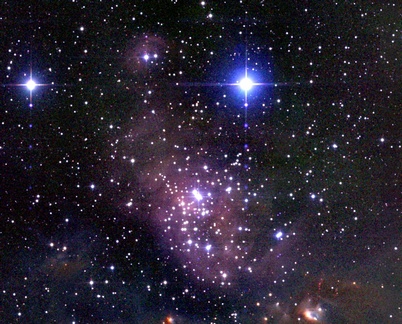
Figure 5 - J/H/Ks color composite showing a 0.5°x0.4°
region in the core of the IC348 star formation region 6x field. |
 |
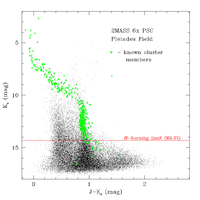 |
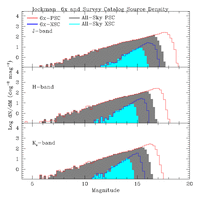
| Figure 6 - Comparison of 6x and All-Sky PSC and XSC
differential source counts in the 28.3 deg2 6x Lockman Hole
field. Counts are and scaled by area. |
Figure 7 - Click on this image to view a blink comparison between
the color-magnitude diagrams from the 2MASS 6x-PSC and All-Sky Release PSC
for objects in the 5.3 deg2 Pleiades 6x field. |
- 191,464,020 point source and 403,811 extended source
detections extracted from observations of the 35
8.5´×1° calibration fields
that were measured nightly during 2MASS survey operations. Each field
was scanned between 562 and 3692 times over the 3.5-year duration of the
survey, so the Calibration Working Databases are highly redundant,
multi-epoch data sets.
- 878,769 photometrically and calibration FITS images in
the three survey bandpasses constructed from all 2MASS survey calibration-mode
observations.
- 5,041,472 point source and 9,709 extended source
detections extracted from observations of 5 special
8.5´×1° calibration fields in and around the LMC and SMC.
These fields were scanned between 108 and 468 times in support of
the long exposure (6x) observations of those fields. The special calibration
fields were observed with the same exposure times and scanning strategy
as the main survey calibration fields.
- 18,504 photometrically and calibration FITS images in
the three survey bandpasses constructed from the special LMC/SMC
calibration field observations.
 |
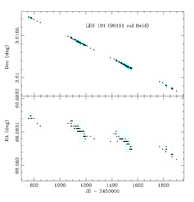 |
| Figure 8 - Phase-folded J and Ks light curves and
magnitude-color behavior constructed using the 2977 independent measurements
of an RR Lyr variable in the 90004 calibration field (courtesy A. Becker). |
Figure 9 - Position of LHS 191 as a function of
time from the 1839 independent observations of the 2MASS 90191 calibration
field, showing the proper motion (1.022 arcsec/yr) and parallax
(0.056 arcsec) of the nearby M-dwarf star.
Cyan points are positions from individual calibration scans, and black points
are average positions from six scans in each calibration field observation.
|
In addition to the primary extracted source databases
and calibrated image products from the main survey, long exposure (6x)
and calibration observations, the 2MASS Ancillary Products include
two "value-added" products that are designed to assist users in
exploiting the multi-epoch 2MASS observations:
-
Tables containing the combined
position and brightness information for point and extended sources detected
more than once in each of the 2MASS survey, long exposure (6x) and calibration
data sets, along with
assorted statistics on flux and position distributions for each merged
object. These tables, used in conjunction
with the respective Catalogs and Working Databases, provide
the best available estimate of flux and position from 2MASS for sources
that benefited from more than one observation during the survey.
- The Cross-Reference tables provided for the Merged Survey, Long-Exposure
(6x) and Calibration Tables link each merged source entry with the
individual epoch measurements in the respective extracted source
Working Databases.
 |
 |
| Figure 10 - Click on this image to view a blink comparison
between the color-magnitude and
two-color Hess diagrams for sources in the 2MASS Survey Merged Point Source
Information Tables and the All-Sky Release PSC within 20° of the north
galactic pole. Note the improved definition of the main stellar population
features for faint sources in the Merged Point Source color-magnitude
diagram. |
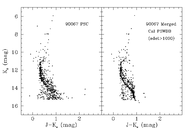
Figure 11 - Color-magnitude diagram from the 2MASS PSC (left)
and Calibration Merged Point Source Information table (right) for
objects in the 90067 calibration field detected more than 1000 times.
Note the clear delineation of the main sequence and binary main
sequence in the Merged Calibration color-magnitude diagram. |
- A set of photometrically and astrometrically calibrated FITS images
constructed by optimally combining the 562-3692 independent observations
of each of the 35 2MASS Calibration fields acquired during
Survey operations.
The images reach 3.5-4.5 magnitudes deeper than the single epoch
measurements and cover a total area of approximately 6 deg2.
A table of 246,760 sources detected in each of the deep,
Combined Calibration Scan FITS Images is also provided. These provisional
source extractions have simple aperture photometric measurements
bootstrapped to the brightness of the standard stars in each Calibration
field, and are useful for comparing with the results of independent
extractions by users of the data.
 |
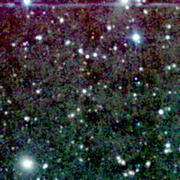 |
| Figure 12 - Click on this image to view a comparison
between images from a single epoch
2MASS calibration observation of the 90004 Calibration field, and the
Combined Calibration image constructed using 1400 independent observations
of the field. |
Figure 13 - Click on this image to view a comparison between
a deep 2MASS Combined
Calibration image and SDSS image in the 90004 calibration field
illustrating their complementary depth. |
Standard Acknowledgment for Use of 2MASS Data in Astronomical Publications
Please include the following in any published material that makes use of the 2MASS data products:
"This publication makes use of data products from the Two Micron All Sky
Survey, which is a joint project of the University of Massachusetts
and the Infrared Processing and Analysis Center/California
Institute of Technology, funded by the
National Aeronautics and Space Administration and the National Science
Foundation."
Thank you very much.
Last update: 2008 March 12, Mail the 2MASS Helpdesk
Return to the 2MASS Home Page
 The Two Micron All Sky Survey at IPAC
![]()
 The Two Micron All Sky Survey at IPAC


